
Blog
Is Your Training Data Representative? A Guide to Checking with PSI in Python
Understanding the Importance of Representative Training Data
In the world of machine learning, the quality of your training data plays a pivotal role in determining the success of your models. Training data that accurately represents the problem space can significantly enhance model performance and generalization. However, ensuring that your data is truly representative can be challenging. In this guide, we will explore using Population Stability Index (PSI) in Python to check the representativeness of your training data.
What is the Population Stability Index (PSI)?
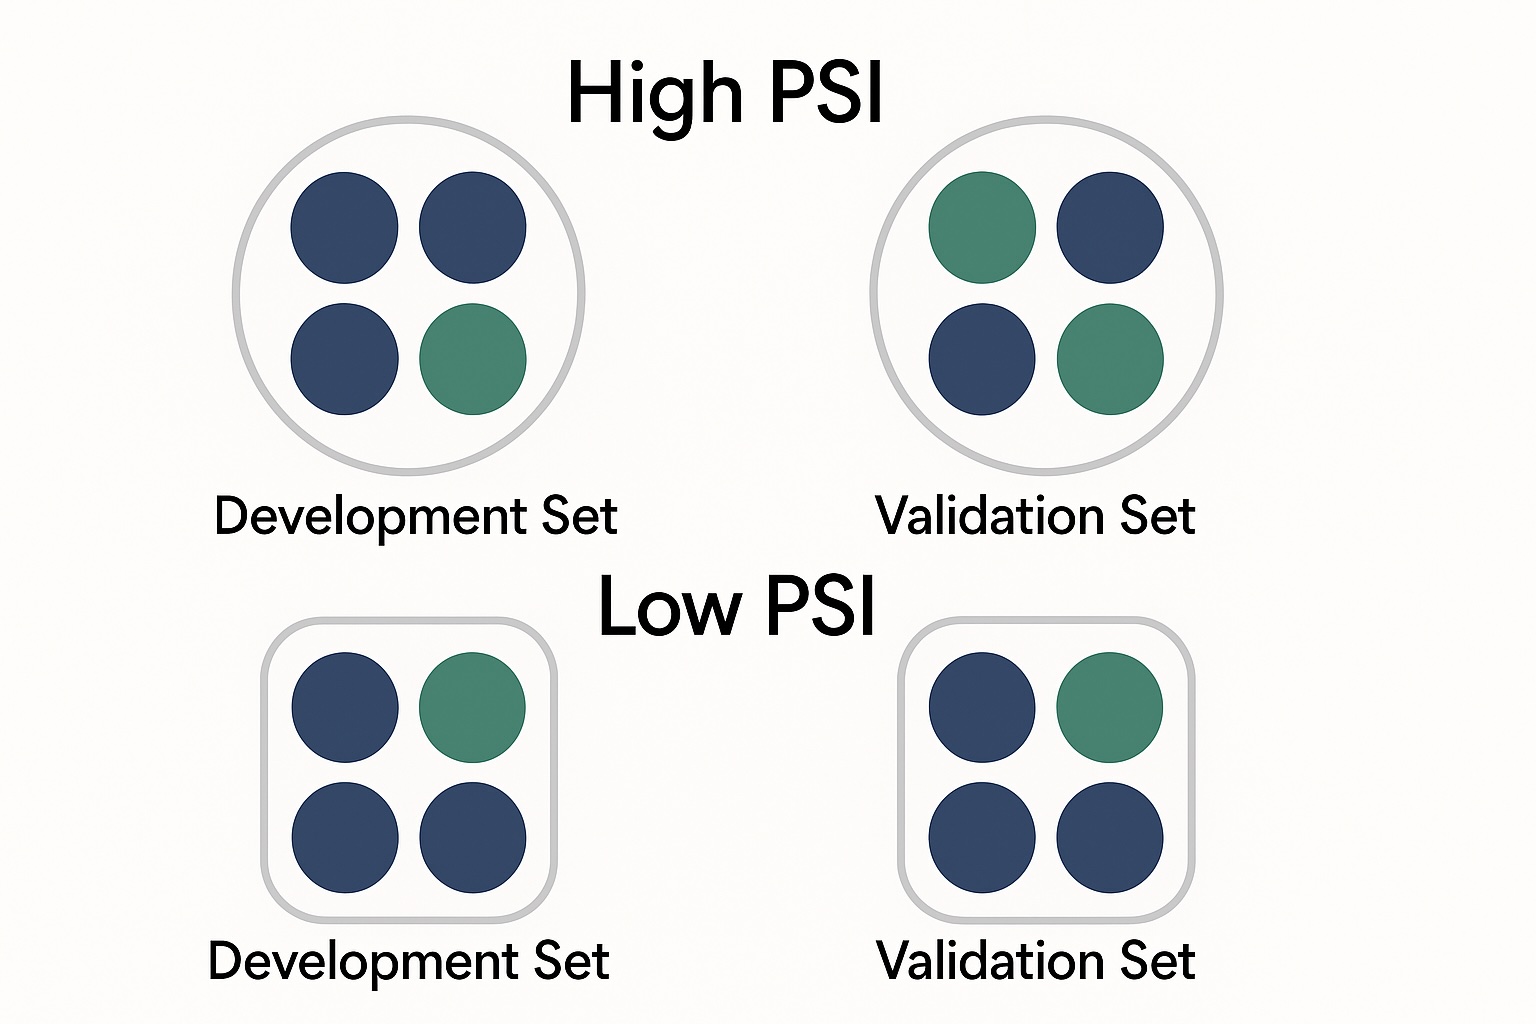
The Population Stability Index is a statistical tool used to measure the stability of a population over time. In the context of machine learning, PSI helps assess whether the distribution of features in your training dataset remains consistent with that in the validation or test datasets. A significant deviation can indicate potential issues that may lead to performance degradation when the model is deployed.
Why is Testing Data Representativeness Important?
Testing the representativeness of your training data is crucial for several reasons:
- Model Reliability: Models trained on unrepresentative data may produce unreliable predictions in real-world scenarios.
- Bias Detection: Checking for representativeness helps identify biases in the training data, enabling corrective actions.
- Improved Generalization: Models that rely on representative training data are more likely to generalize well to new, unseen data.
- Data Drift Detection: Monitoring PSI over time can indicate changes in the underlying population, alerting you to potential model retraining needs.
How to Calculate PSI in Python
To calculate PSI, you’ll need to follow a structured approach. Let’s break it down into manageable steps:
Step 1: Prepare Your Data
Begin by defining your training and validation datasets. Ensure both sets are cleaned and pre-processed uniformly. Typically, you’ll want to focus on the same feature distributions.
python
import pandas as pd
Load your datasets
training_data = pd.read_csv(‘training_data.csv’)
validation_data = pd.read_csv(‘validation_data.csv’)
Step 2: Define the PSI Function
Next, you’ll implement a function to compute PSI. The PSI function calculates the expected proportion of observed values in the two datasets and produces the PSI value.
python
def calculate_psi(expected, actual, bins=10):
Calculate the expected and actual distributions
expected_perc = pd.Series(np.histogram(expected, bins=bins)[0] / len(expected))
actual_perc = pd.Series(np.histogram(actual, bins=bins)[0] / len(actual))

# Handling the values where the actual percentage is zero
psi_value = (expected_perc - actual_perc) * np.log(expected_perc / actual_perc)
return psi_value.sum()
Step 3: Use the PSI Function
Once you have the PSI function defined, you can apply it to the relevant features. Choose a feature or feature set to analyze, and calculate the PSI.
python
Specify the feature to analyze
feature = ‘feature_name’
Calculate PSI
psi_value = calculate_psi(training_data[feature], validation_data[feature])
print(f’PSI value for {feature}: {psi_value}’)
Interpreting the PSI Values
Understanding the PSI output can guide your data strategy:
- PSI < 0.1: This indicates that the training and validation datasets are similar, suggesting good model representativeness.
- 0.1 ≤ PSI < 0.2: Indicates moderate differences. It may not be critical, but further investigation is warranted.
- PSI ≥ 0.2: Suggests significant distribution differences, signaling that your model may face serious performance issues when applied to the validation data.
Additional Considerations for Using PSI
While the PSI provides valuable insights, there are some important considerations to keep in mind:
- Multiple Features: Calculate PSI for each feature independently to identify specific diverging aspects.
- Time Dependency: If you operate in a dynamic environment, consider calculating PSI over time to detect trends.
- Domain Expertise: Engaging with domain experts can provide context for PSI findings, guiding necessary data adjustments.
Enhancing Data Representativeness
If your PSI calculations reveal inconsistencies between your training and validation data, consider the following strategies to improve representativeness:
Feature Engineering
Develop new features that capture underlying trends in your data to enrich training sets.
Data Augmentation
Use techniques like oversampling, undersampling, or synthetic data generation to balance the datasets better.
Continuous Monitoring
Implementing regular PSI tracking can help identify shifts in the data distribution over time, allowing for timely interventions.
Conclusion
Ensuring that your training data is representative is vital for the long-term success of your machine learning models. By utilizing the Population Stability Index in Python, you can quantitatively assess the stability of your data distributions, enabling you to make informed decisions on data preparation and model training.
Stay proactive in monitoring PSI and continuously improving your datasets to enhance model performance and reliability. With a committed approach to data quality, you’ll set your machine learning initiatives on a path to success.

